Compilation, Fast Enough to Fit Under 1s
I finally pushed the average end-to-end compile time of the GDScript scripts in the automated test suite under 1 second. After half a month of passionately wrestling with the GDExtension ABI and Clang (possibly with my sanity already gone),
GDCC#37, this 50k-line monster PR, has been merged. So I should probably write down this magical storyincident, just to recover a bit of SAN.
Background
Since ancient times? the project has been haunted by painfully slow tests. GDCC has more than 1,700 unit tests, and each test compiles the GDScript script it uses into a GDExtension library, then starts the Godot engine to run it inside a real project. That slow compile step dragged the whole suite down badly enough that every GitHub push triggering CI took close to an hour.

Who could stand that?! How did I even put up with this for months
Help me, Mr. Timing!
When a story ends, we always think back to where it began.
What is the origin of all optimization methods?
Correct. It is timing!
Every performance optimization starts with knowing where the time is going. After inserting 20 timing probes across the whole compile-and-run path, we got detailed timing data for each stage:
total=10347.222msresources.source=0.390msresources.validation=0.288msvalidation.prepare=0.158msworkdir.prepare=0.117msfrontend.lower=18.281msruntime_class.check=0.016ms
build.total=9100.728msbuild.include=317.310msbuild.codegen=38.321msbuild.write=0.570msbuild.inputs=0.048msbuild.native_compile=8744.444ms
godot_project.prepare=6.475msgodot.total=307.706msgodot.binary_lookup=0.022msgodot.process_start=2.115msgodot.first_output=35.031msgodot.run_until_stop=217.989msgodot.process_wait=305.393msgodot.stream_collect=0.003msoutput.assert=0.068ms
The result was very “straight”forward, as flat and obvious as a steel plate: 90% of the time was spent inside the C compiler. The next biggest cost was generating support library code. These two costs became the main battlefield.
The great compiler investigation
What exactly was the compiler doing? What kind of twisted fate makes a chunk of plain C code take 9 seconds to compile?
To solve this mystery, we used -ftime-trace and traced Clang’s internal behavior:
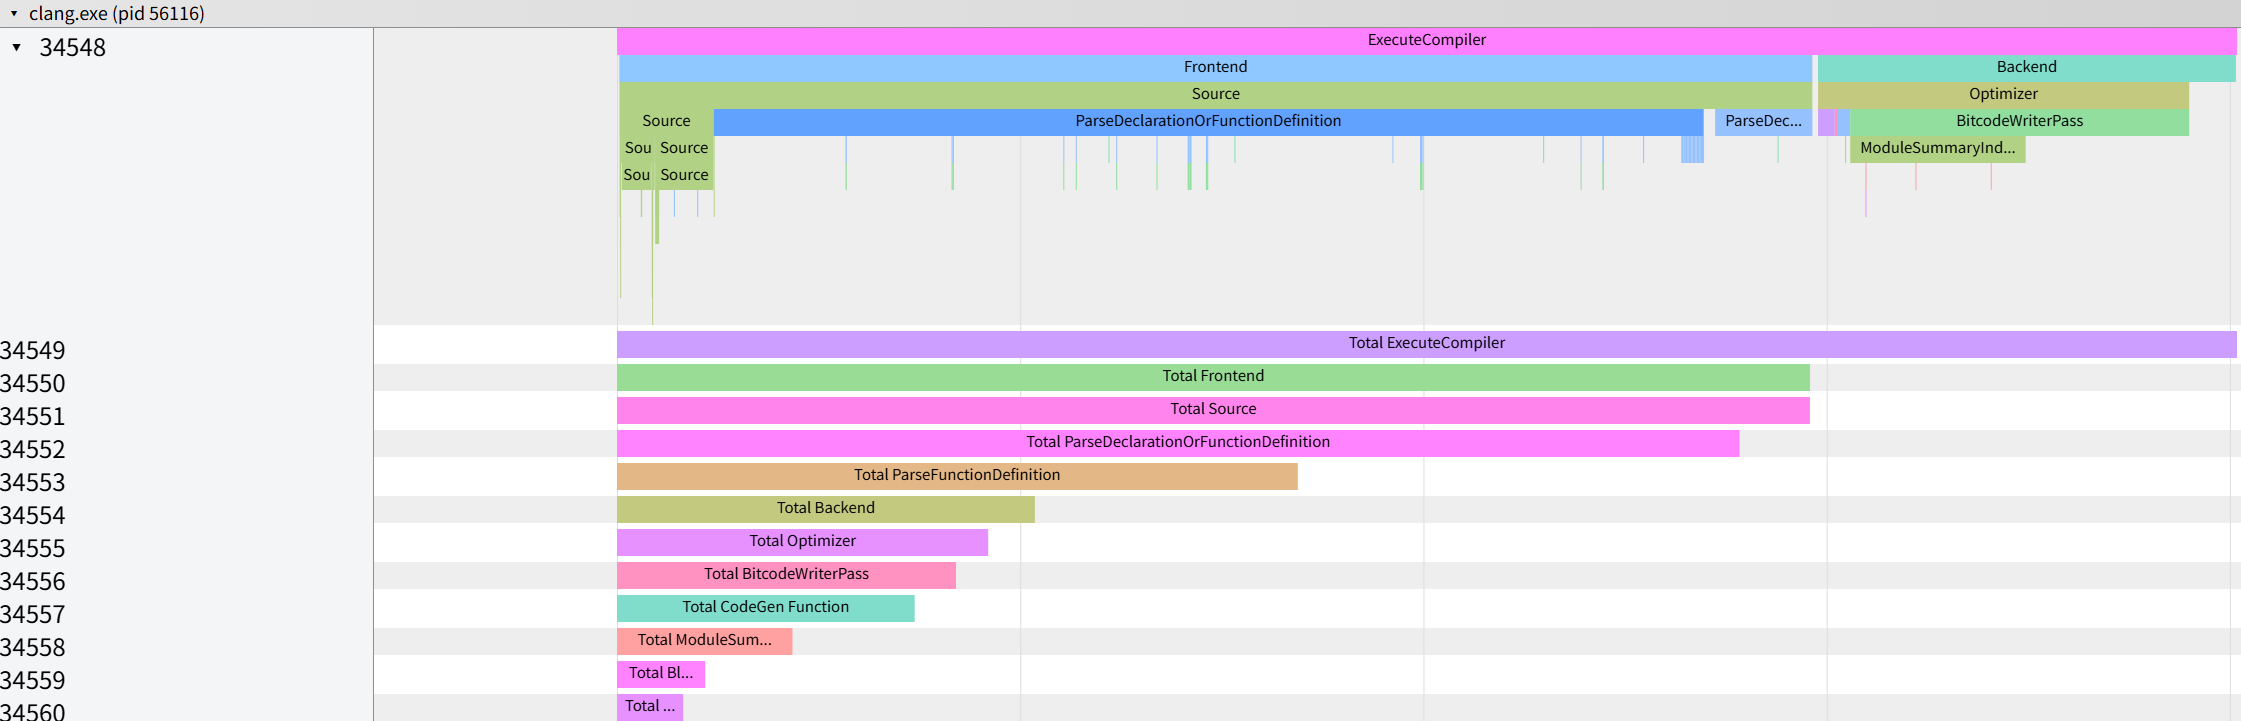
Almost all of it was parsing function definitions. Where did all these functions come from…
Wait, no!
Sins from a previous life
Yes, there were more than 60,000 functions. All of them. Every Godot function. To support static call dispatch everywhere, I had pre-generated the whole thing. One million lines of code. Each build only used a few hundred lines, while the compiler and linker kept silently carrying the rest.
Through all those passing ages, like a sharp peak rising from flat ground, like a giant unresolved problem sitting right in front of us, the promise of this terrible implementation sat there, noticed by no one. There she was. There it was…
Declare war on redundant code!
Ah, sorry, looks like my brain got cooked. The weather has been too hot lately ( ̄﹃ ̄)
Layering the functions
To reduce the extra-long compile time caused by a huge amount of redundant binding code, we split the Godot bindings into several categories instead of treating every Godot pointer function as a module-private generated item.
Roughly, there are three layers:
-
Bindings already provided by the runtime
These bindings do not have much to do with any specific script module. They depend on the Godot version, API metadata, and GDCC runtime helper functions.
For example:
- GDExtension interface wrappers
- Built-in type constructors, destructors, methods, member variables, and operator overloads
- Global utility functions
- Functions used by fixed helpers/templates
- Helper function wrappers GDCC always needs
These are collected into a provided set.
-
Fixed support layer bindings
Some bindings cannot be handled just by expanding API metadata in bulk, because they are always needed no matter what. For example, some singletons, type registry databases, object lifetime paths, Variant functions, and similar pieces. These are generated once by the fixed binding mechanism and placed into versioned support files.
-
Module-local bindings
Only things that truly change based on what the current GDScript script actually uses become module-local bindings.
Right now, this mainly means:
- Singleton pointers actually used by the current script
- Constants actually used by the current script
- Methods of engine classes that are actually used
- Constructors of engine classes that are actually used
Only this kind of function is written into the generated header. After this change, module generation no longer has to output one giant “cover everything” collection, which sharply reduces the number of generated functions.
Filter out bindings that already exist with the provided set
As mentioned above, we introduced an explicit “set of C function names already provided by the runtime”.
When generating function bodies, if the code calls a C function, the system first checks whether that function already exists:
- If it is already provided by the runtime support library, built-in type support, global utility functions, or similar categories, the current module does not generate another copy.
- If it is not provided, and this module really needs it, it must be explicitly registered as a module-local binding.
- If it is neither provided nor explicitly registered, the compiler reports an error directly, so nothing sneaks in silently.
In other words, this avoids the old habit of “I saw a Godot function name in the C code, so let’s generate extra wrappers just in case”.
Collect per module, and only commit bindings used by successfully generated functions
This time, the Godot function usage collector is no longer a global pile of anything-goes state. It is now a module session plus function buffers.
The flow is roughly:
CCodegen.generate()creates a module-levelGodotBindingUsageSession.- Each generated function body gets a temporary
GodotBindingUsageBuffer. - After the function body is generated successfully, that buffer is committed into the module-level session.
- If a function body fails to generate, the temporary bindings recorded inside it do not pollute the final header.
What this design reduces is “speculative bindings”. In other words, only code paths that successfully enter the final generated C code can cause bindings to appear in the final module header.
This helps both compile speed and debugging. Failed intermediate paths no longer leave behind extra function bindings, and the binding count stays much closer to what the module actually needs.
Deduplicate by canonical key instead of function name
Module-local bindings are not just thrown blindly into a collector. They are merged by canonical key. The canonical key is generated from the family, owner, name, cFunctionName, and signatureKey in the GDExtension metadata.
That means if the same binding is used by multiple functions or multiple paths, it is emitted only once.
If two bindings have the same C function name but incompatible signatures, the system reports a conflict directly instead of generating two function bindings with the same name but different meanings. This reduces duplicate bindings and avoids the wild bug where later output overwrites earlier output and the program somehow keeps running.
Built-in types and global functions are no longer generated for every script
This is a major part of the binding count reduction.
Built-in types and global functions have a few key traits:
- There are many of them. A lot. Really, really many.
- They are strongly tied to the Godot version.
- They do not change based on one specific GDScript script module.
- Many tests repeatedly use the same basic function binding set.
So pre-generating them into the binding set is just perfect, right~
btw, this does not mean all built-in type and global function code disappeared. The support files in the repository did get larger, but each module build no longer repeatedly generates and compiles a huge pile of module-private bindings. Most of the build speed improvement comes from here.
The forbidden fruit
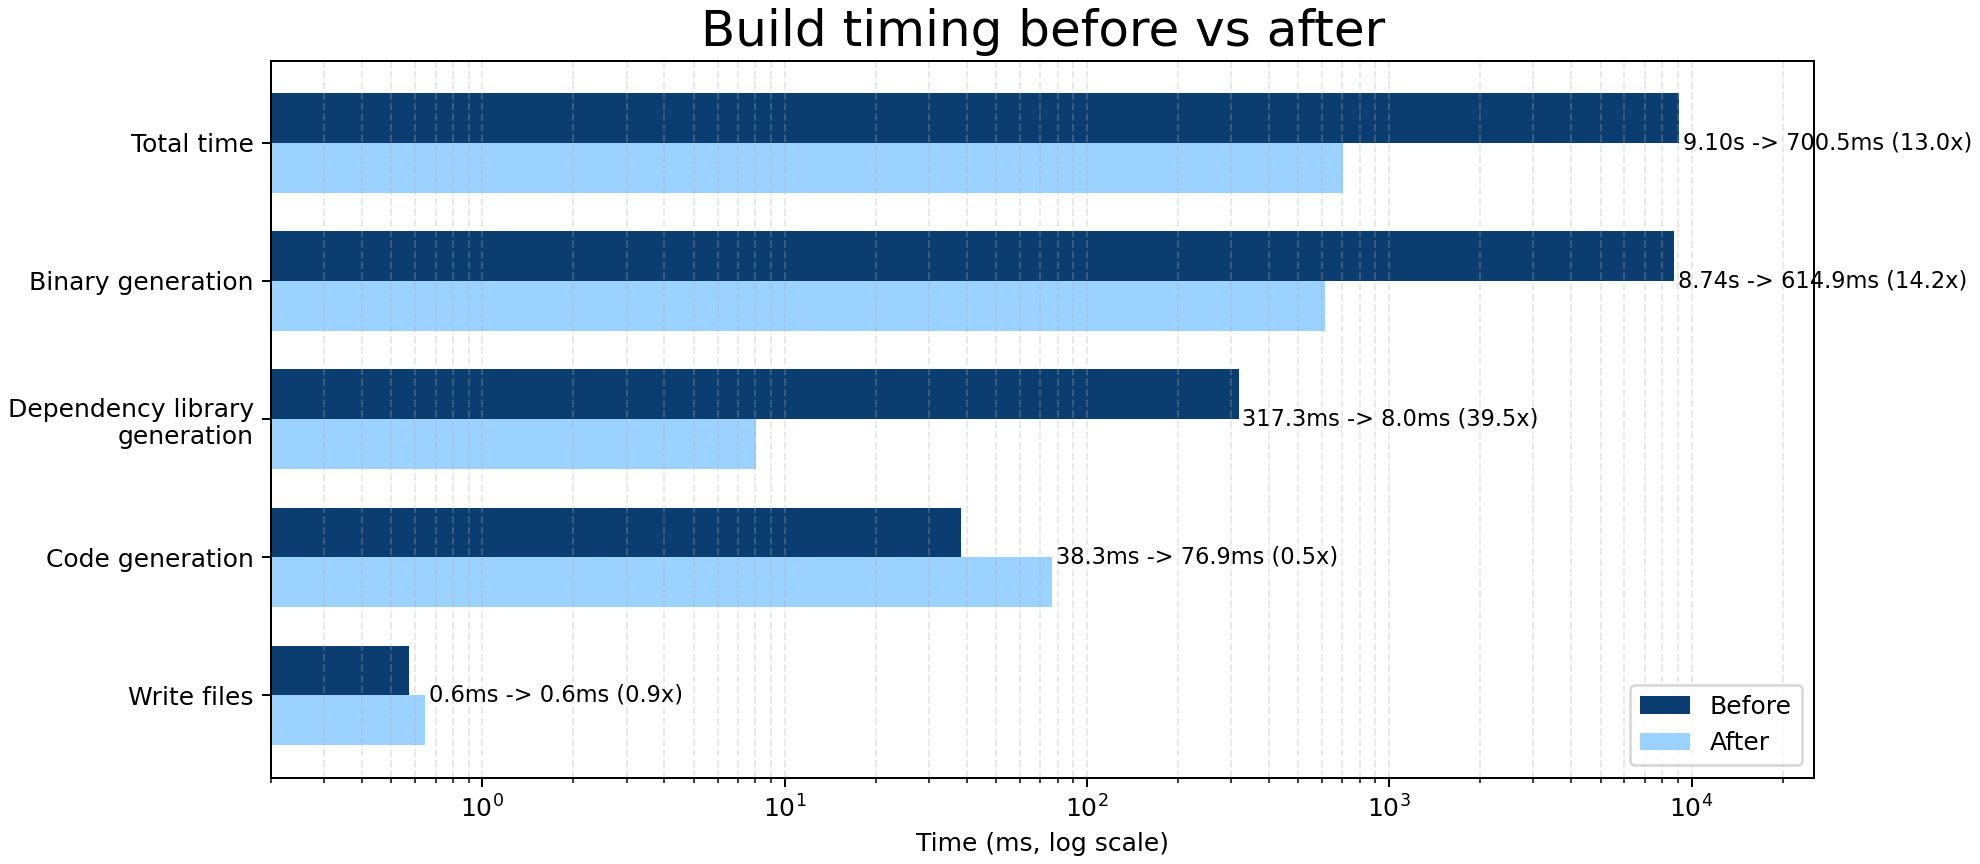
From the timing data, the result is extremely pretty:
- build.total: 9.10s -> 700.5ms
- build.native_compile: 8.74s -> 614.9ms
- build.include: 317.3ms -> 8.0ms
End-to-end compile time was pushed below 1 second. This grandly proves that the main gain did not come from GDCC code generation getting a little faster. It came from making the C compiler process much less stuff:
- It parses far fewer binding functions.
- It handles far less unused inline code.
- It expands far less error handling code.
- It compiles far fewer repeated module-local bindings.
- It deals with much smaller headers.
For the test suite, this speedup gets amplified. Every test case creates a temporary project, and previously, each test could repeatedly pay the cost of “generate and compile a lot of bindings”. Now those stable bindings have moved into the shared layer, so each test’s module code is much smaller.
The GitHub Action build time also successfully dropped under 3 minutes. A huge leap, friends! (well, maybe still not that fast):

Now I can finally implement new operators happily~ Development efficiency increased again and again and again.
Afterword
Maybe I wrote too much code yesterday, because the first half of this post feels a bit overheated and cloudy. Please forgive the haze. I wrote down this pile of scattered thoughts so future me can still remember it, instead of getting kicked to death by the giant problem I kept ignoring.